You see an OpenFOAM simulation of a single phase stirred tank reactor using AMI technique. This simulation is performed to find the residence time distribution (RTD) in a stirred tank reactor.
In the design and scale-up of chemical reactors, the residence time distribution of fluid particles inside the reactor should be known. This information can help us to better design a reacting system (find the operating problem of a reactor) or predict the performance of a reactor under a given operating conditions.
The Residence Time Distribution (RTD)is obtained by injecting an inert substance or molecule, as tracer, into the reactor (reactor inlets) at t = 0 and measuring the tracer concentration in the outlet stream of the reactor. The tracer should be nonreactive. Its physical properties should be similar to the fluid and it should not affect the flow behavior of the fluid in the reactor. It should not be adsorbed on the reactor walls so that it completely reflects the flow behavior of the reactor.
In experiments, colored or radioactive materials are commonly used as tracer. The injection method can be a pulse input or a step input. The same procedure can be followed in flow simulations based on CFD. A number of tracer particles are injected from the reactor inlet and the inventory content of tracer particles or the exit concentration of tracer particles is tracked over time to find Residence Time Distribution (RTD).
In the simulation below, tracers are small , artificial particles with density 1000 kg/m3 (similar to fluid density). These particles with small time constant follow the flow path and since program performs one-way coupling, tracer presence does not affect the flow behavior. Since the perfect pulse injection is not possible, tracer particles are injected for 1 second.
OpenFOAM solvers do not implicitly provide such information to us. However, there are some useful tools for particle/tracer tracking in flow system that can be used in simulations. Here is a tutorial on how to use these tools.
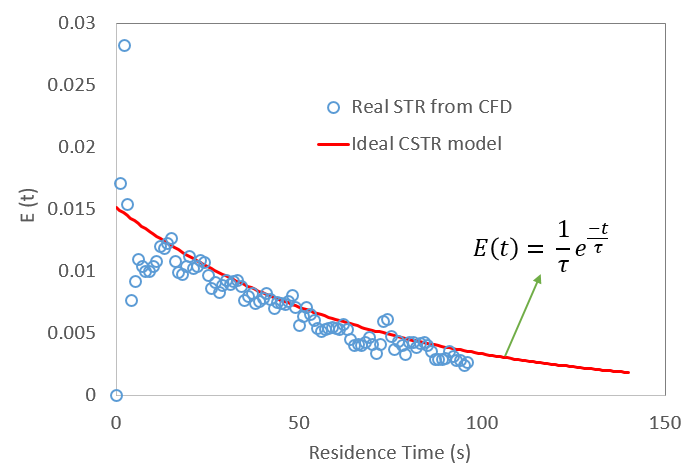
In the figure below, the results of the above CFD simulation were post-processed to obtain E(t) function (RTD function) in the reactor. The results are also compared with the ideal CSTR model.


Hi, I’m a civil engineering and I’m doing my thesis about a stirred tank like this, would be possible for you to upload the files from this simulation or, at least, a tutorial?
Hi Carlos,
We are planning to share the tutorial of the simulation of an stirred tank reactor in two months.
Hi,
How did you post process the results to generate the e(t) curve? I have completed your very helpful rtd tutorial but am unsure how to post process it.
Is there a built in function object? If not I was considering writing a utility that counts the number of particles in the domain at each time step and using that.
Thanks,
Alex
Hi Alex,
In each time folder, you have a sub-folder /uniform/lagrangian/kinematicCloud that contains a file named “kinematicCloudOutputProperties”. In that file, you can see the number of escaped particles from your simulation. The rest is straight forward then.
What solver did you use to run this simulation?
pimpleFoam.
Hi,
Is there a faster way to post process the number of particles in certain point? Or another way to post process the particles.
Thanks.
Hi, I am not aware of any other method rather than this.
Hi,
I followed your tutorial and I got the positions of the particles in each time step, but I can’t calculate the RTD. Can you tell me if there is a simple method for calculating RTD from Lagrangian positions?
Thanks
Hi, the residence time is defined as the time that a fluid particle stays in the vessel/container. You have the instance of particle injection. You also have the position of particles (fluid particles) at each instance of simulation (let this t=0). So, you can calculate what fraction of particles (cumulative) has left the vessel at time t. Now draw this fraction as a function of time. You will have the cumulative residence time distribution. The derivative of this curve will give you RTD.
Hi…
I would also like this tutorial. Can you send it to me by e-mail?
Regards
M. Fatyga